Unveiling Hidden Patterns: Clustering Analysis with ISMIP6 Models
A PCA and Clustering Analysis
Introduction
How do different Global Climate Models (GCMs) impact the projections of ice sheet behavior in ISMIP6 simulations?
What is the influence of ocean forcing on the projections of ice sheet dynamics in ISMIP6 models?
How do different Representative Concentration Pathways (RCPs) affect the projected outcomes of ice sheet models in ISMIP6?
These are questions that have been asked within the ice sheet community in the recent years as new data, methods, and ideas have been discovered. The Ice Sheet Model Intercomparison Project for CMIP6 (ISMIP6) aims to address these questions by providing a framework for evaluating and comparing the responses of ice sheet models to various climate scenarios. ISMIP6 integrates multiple GCMs, RCPs, and ocean forcing parameters to project the future behavior of the Greenland and Antarctic ice sheets.
This study focuses on analyzing the RCP experiments and looking at one key variable Surface Mass Balance flux (acabf). Principal Component Analysis (PCA) will be used to analyze the variables, aiming to uncover patterns and groupings in the data. Hypothesis: By implementing PCA and Clustering methods,it is possible to uncover hidden patterns in the ISMIP6 simulation data, enabling more efficient data reduction and grouping of similar data points for further analysis.
Materials and methods
Narrative:
This study utilizes the ISMIP6 dataset to analyze Surface Mass Balance (SMB) projections for the Greenland (GIS) and Antarctic Ice Sheets (AIS) under different Representative Concentration Pathways (RCPs). The data, sourced from the Center for Computational Research (CCR) at the University at Buffalo, is publicly accessible and was processed and analyzed in R. The ISMIP6 data includes SMB projections for various models and experiments (e.g., RCP8.5 and RCP2.6), providing insights into potential future changes in ice sheet mass balance.
Code/Script Format:
The extensive codebase is divided into multiple R scripts:
file_script.R = For setting up the variables, experiment types, and to assign the date
data_extraction.R = Extracting the variable data based on the date (2015).
Clean_data.R = To flatten the data points and then convert zero to NaN and drop across all models.
PCA_script.R = To standardize the data points and to impliment the PCA. This also contains plots for visualizations.
Data:
The file format of the ISMIP6 data is <variable>_<IS>_<GROUP>_<MODEL>_<EXP>.nc. Variable = SMB, IS is either Greenland (GIS) or Antarctica (AIS), with the model names and groups, along with the experiment types 05 & 07 (RCP8.5 and RCP2.6).
More information on ISMIP6 and CCR can be found at:
Packages
ncdf4: For reading and writing NetCDF files.
raster: For raster data manipulation.
terra: For geospatial data manipulation.
ggplot2: For data visualization.
plotly: For interactive data visualizations.
Results
PCA Plots:

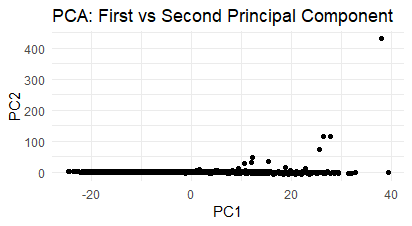
(Fig. 1) This scatter plot represents the PCA scores for the first and second principal components (PC1 and PC2) derived from the standardized data. Each point in the plot corresponds to a data observation, and the plot helps visualize the variance captured by the first two principal components.

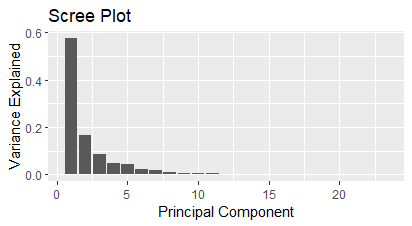
(Fig. 2) This Scree plot displays the variance explained by each principal component. The “scree” refers to the plot of variance, where the x-axis represents each principal component and the y-axis represents the proportion of variance explained by that component.

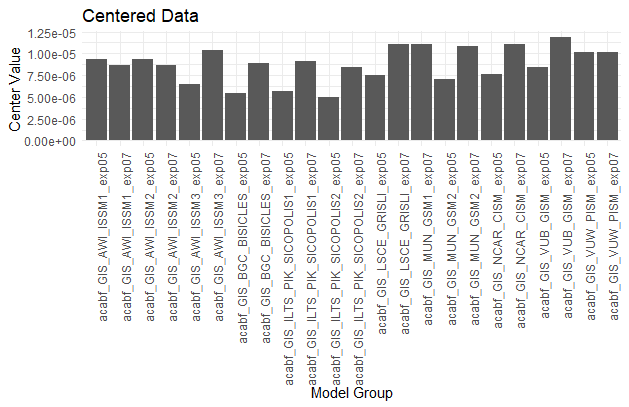
(Fig. 3) Data where the mean of each variable is subtracted, resulting in a new dataset where the mean of each variable is 0. This focuses analysis on variations from the mean.

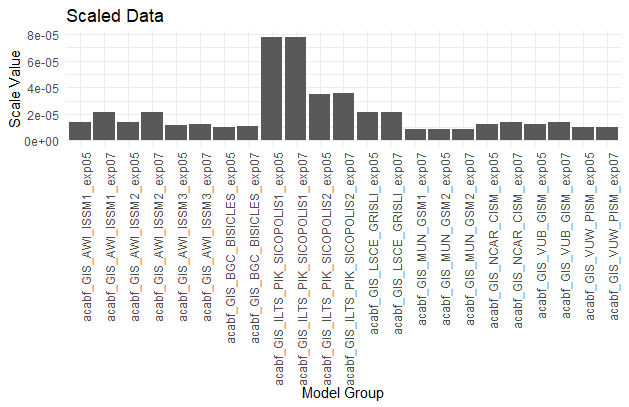
(Fig. 4) Data where each variable is scaled by its standard deviation, resulting in variables with the same units of measurement and variance of 1. This ensures no single variable dominates the PCA due to scale.
The centered and scaled plots give insight into how the data was transformed to focus on meaningful variations (after centering) and to ensure fair contribution from each variable (after scaling).
Conclusions
The centered data represents the transformation where the mean of each or model group has been subtracted. This step shifts the data such that the new mean for each variable becomes zero. As you observed, the centered data displays moderate to high values, indicating that while the values of the model groups are now centered around zero, they still have a range of values that is not vastly different between the model groups.
For the scaled data, the data that has been normalized by dividing by the standard deviation of each variable and to ensure that each model group contributes equally to the PCA. However, there are two model groups that are high which could mean that they had greater variability in their SMB values.
This type of high values might be an indication for outliers. As they are both from the same model group and two different experiment types it can be argued that it was the conditions that the group set themselves when running the models.
Other Plots

References
Jaadi, Z. (2024, February 23). Principal Component Analysis (PCA): A Step-by-Step Explanation. Built In. https://builtin.com/data-science/step-step-explanation-principal-component-analysis.
Ibm. (2024, August 23). PCA. IBM. https://www.ibm.com/topics/principal-component-analysis.
GeeksforGeeks. (2024, September 10). Principal Component Analysis(PCA). GeeksforGeeks. https://www.geeksforgeeks.org/principal-component-analysis-pca/#